
US Census and American Community Survey
Aggregate Data
How Can Census Data Be Public and Still Protect Privacy?
When you respond to the Census or ACS, your personal information is protected by law for 72 years. So how can researchers and the public access this private information?
The answer is aggregation. Instead of publishing individual responses, the Census Bureau releases data as counts, percentages, or averages for groups of people based on geography, time period, or other factors.
For example: You can’t look up how your neighbor responded—but you can look up how people in your census tract responded overall. That’s aggregate data: individual privacy is protected, but you can still study trends in the group.
Why geography matters:
- In densely populated areas like Milwaukee, data can be reported at smaller geographic levels because there are enough people to protect anonymity.
- In rural areas with fewer people, the Census releases data for larger geographic zones to avoid disclosing personal details by accident.
That’s why some maps show small areas in cities, but huge areas in the countryside. The population size—not just land size—drives how detailed the data can be.
You've probably heard of Census Tracts, but there are many other geographic units the Census Bureau uses to aggregate data. Keep exploring this guide to learn how it all fits together!
Legal and Statistical Areas
Legal vs. Statistical Areas
For statistical purposes, the nation is subdivided into two main types of geographic areas, legal and statistical.
Legal areas are defined specifically by law, and include state, local and tribal government units, as well as some specially defined administrative areas like congressional districts. Many, but not all, are represented by elected officials.
Example: State of Wisconsin
Statistical areas are defined directly by the Census Bureau and state, regional or local authorities, and include census tracts and urban areas. The primary purpose of statistical areas is to tabulate and present census data.
Example: Metropolitan Statistical area - "Milwaukee-Waukesha-West Allis MSA"
[source]
Census Gegoraphy Hierarchy
What Is Census Geography?
When the U.S. Census Bureau collects and shares data, it organizes that information by geography. These geographic units work like nesting dolls or building blocks where small pieces fit into bigger ones.
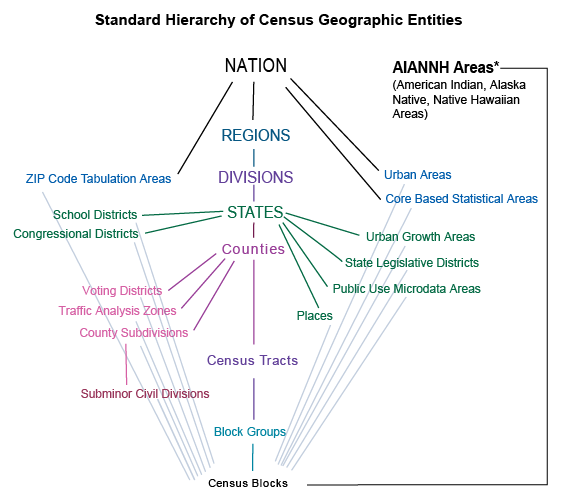
At the smallest level are Census Blocks, the tiniest units, usually the size of a city block in urban areas. A group of blocks makes up a Block Group. Block Groups fit into Census Tracts, which then roll up into Counties, and so on. This structure helps researchers “zoom in” or “zoom out” depending on the level of detail they need.
Here’s how they fit together:
- Block → smallest unit (like a LEGO brick)
- Block Group → a cluster of blocks
- Census Tract → usually about 4,000 people, made up of several block groups
- County → includes many tracts
- State → includes all counties
- Nation → all 50 states + territories
When you use tools like Social Explorer or NHGIS, knowing this hierarchy helps you choose the right level of detail for your research.
The illustration below shows a hierarchy of the census geographies. Blocks, on the bottom, are the main building block of all other census geographies.
Differentiate between types of areas
Population Density, Milwaukee, Wisconsin
Hint: Expand the arrows at the upper left corner of the map to view the legend.
This map shows population density in Milwaukee using Census Block Groups.
Polling Place Locations, Milwaukee, Wisconsin (2012)
Hint: Click on an area in the city to view information about the local polling place.
This map of polling place locations uses Voting Wards, not a census geography, per se! However, census data is referenced heavily in the creation of voting wards to ensure efficient and fair voting.
Milwaukee, Wisconsin Neighborhoods
Modifiable areal unit problem
-
Modifiable areal unit problem Wikipedia PageThe Wikipedia page for the MAUP provides some great high level information about the topic.